Welcome to my Portfolio
My fascination with technology began with a simple question: How can we use code to solve real-world problems? This curiosity led me to pursue computer science, where I discovered my passion for data visualization and React.js development.
Over the years, I’ve transformed raw data into meaningful insights and built dynamic, user-centric web applications. Each project has been a learning opportunity, pushing me to grow as a developer and problem-solver. From debugging complex code to designing intuitive interfaces, I’ve embraced every challenge as a chance to innovate.
This website is a testament to my journey—a collection of my work, skills, and the lessons I’ve learned along the way. I invite you to explore my projects and join me as I continue to evolve, create, and make an impact in the world of technology.


A Little about me...
Welcome to my Portfolio, showcasing my projects, skills, and achievements in computer science to attract potential employers and collaborators.
I’m a computer science student expertized in data visualization and React.js development. With a strong foundation in transforming complex data into intuitive visual insights and building dynamic, user-friendly web applications, I strive to create impactful solutions that bridge technology and user experience.
Here, you’ll find a showcase of my projects, skills, and passion for crafting clean, efficient, and visually engaging applications. Let’s connect and explore how we can bring data to life and build the future of the web together


Discover My Journey
Explore my experience, education, and certifications in data analysis, designed to demonstrate my capabilities and passion for transforming data into actionable insights.
My journey into the world of computer science began with a curiosity for how technology shapes our lives. Over time, I discovered a passion for data visualization and React.js development, where I could combine creativity with technical skills to solve real-world problems.
From building my first web application to creating interactive data-driven dashboards, every project has been a step forward in honing my craft. Along the way, I’ve embraced challenges, learned from failures, and celebrated milestones—each experience shaping me into the developer I am today.
This website is a reflection of my growth, showcasing my projects, skills, and the lessons I’ve learned. Join me as I continue to explore, innovate, and contribute to the ever-evolving tech landscape.
Work Experience
As a Database Analyst, I designed and optimized enterprise database systems to ensure high performance, scalability, and secure data accessibility. I led migration projects integrating legacy and modern systems, minimized downtime through proactive maintenance, and implemented automated backup and disaster recovery protocols to safeguard business continuity. Leveraging industry-standard databases (Oracle, MySQL, PostgreSQL, SQL Server) and cloud platforms (AWS, Azure), I collaborated with cross-functional teams to deliver resilient, compliant, and efficient data infrastructure that supported critical business operations and decision-making.
Dell Technologies (2025-Present) (Contract)
Data Analyst
May 2025 - Present
Designed, optimized, and maintained enterprise database systems to ensure high performance, scalability, and secure data accessibility. Led migration projects integrating legacy and modern systems, proactively resolving bottlenecks, and implementing best practices in database architecture and maintenance. Collaborated with cross-functional teams to establish robust data models, security measures, and disaster recovery protocols, supporting business intelligence, reporting, and operational continuity. Ensured high system availability and compliance while delivering reliable and efficient data infrastructure.


Key Responsibilities
Database Architecture & Optimization:
Designed and optimized database systems to enhance query performance and data accessibility, implementing indexing and architecture enhancements.
Established best practices for data organization, architecture, and maintenance, ensuring scalability and long-term efficiency.
Monitored database health and proactively resolved bottlenecks to maintain high responsiveness and availability.
Database Migration & Maintenance:
Led successful migration projects, integrating legacy systems with modern platforms while preserving data integrity.
Reduced downtime through proactive maintenance, performance tuning, and rapid query optimization
Implemented automated backup, recovery, and disaster recovery protocols to ensure business continuity.
Database Security & Compliance:
Planned and enforced robust security measures, including encryption, access control, and compliance monitoring.
Ensured sensitive information was safeguarded while meeting industry compliance standards.
Technologies
Databases: Oracle, MySQL, PostgreSQL, SQL Server.
Tools & Practices: Indexing, Performance Tuning, Data Migration, Backup & Recovery, Security & Compliance.
Cloud & Automation: AWS RDS, Azure SQL, Automated Backup Solutions, Monitoring Tools.
This experience not only strengthened my expertise in database administration, performance tuning, and security, but also refined my ability to lead critical migration projects, design resilient data systems, and ensure business continuity through proactive database management.
Work Experience
As a Data Analyst at Arvest Bank, a leading bank, I designed and optimized scalable data pipelines for clients across industries, enhancing data accessibility and decision-making. Leveraged cloud technologies (AWS/Azure/GCP) and ETL frameworks. Collaborated with cross-functional teams to deploy robust data models, supporting analytics and AI initiatives.
Arvest Bank(2024-2025) (Contract)
Data Analyst
Aug 2024 - May 2025
Designed, developed, and optimized scalable data pipelines and ETL processes, leveraging modern cloud and big data technologies to deliver efficient and reliable data solutions. Collaborated with cross-functional teams to gather business requirements, architect data systems, and implement robust data models that supported analytics, reporting, and machine learning initiatives. Ensured high data quality, performance, and accessibility while adhering to best practices in data governance and infrastructure.


Key Responsibilities
Data Pipeline Development:
Designed and implemented scalable ETL/ELT pipelines processing 10TB+ monthly data using Python (PySpark), SQL, and AWS Glue, reducing data processing time by 35%
Automated data validation and quality checks, improving dataset accuracy by 25% and reducing manual errors.
Data Warehousing & Cloud Solutions:
Migrated on-premise data systems to Snowflake cloud data warehouse, reducing query costs by 40% while improving scalability.
Optimized real-time data streaming solutions using Kafka and Apache Flink to support live analytics dashboards.
Data Analysis & Visualization:
Developed interactive dashboards in Cognos, Power BI and Tableau that enabled data-driven decisions, improving operational efficiency by 20%.
Created Python scripts (Pandas, NumPy) to automate data analysis workflows, saving 15+ hours/week in manual reporting.
Data Governance & Collaboration:
Established data governance frameworks ensuring compliance with GDPR/HIPAA regulations for client projects.
Partnered with AI/ML teams to deploy predictive models that improved forecast accuracy by 30%.
Technologies
Data Engineering: Python (PySpark, Pandas), SQL, AWS (Glue, Redshift, S3), Snowflake, Airflow, Kafka
Data Visualization: Power BI, Tableau, Matplotlib/Seaborn, Cognos
Databases: PostgreSQL, MySQL, DynamoDB
Tools: Git, Docker, JIRA, SAS (for clinical data)
This experience not only deepened my expertise in data Analysis and cloud architecture but also refined my problem-solving, cross-functional collaboration, and technical leadership abilities, equipping me to design robust data solutions that drive measurable business impact.
Work Experience
During my time at Cognizant, I had the opportunity to grow as a technologist, taking on roles that challenged me to excel in both development and support. As a Full Stack Developer, I designed and implemented end-to-end solutions, building scalable and user-friendly applications. Simultaneously, as a Software Support Analyst, I honed my problem-solving skills by troubleshooting issues, optimizing systems, and ensuring seamless user experiences.
These roles not only deepened my technical expertise but also taught me the importance of collaboration, adaptability, and delivering value to clients. Below, I’ve outlined some of the key projects and responsibilities I undertook during my tenure.
Cognizant Technology Solutions (2021-2022)
Programmer Analyst (Full-Time)
Jan 2021- May 2021
As a Full Stack Developer at Cognizant, I designed, developed, and maintained end-to-end web applications, leveraging modern technologies to deliver scalable and efficient solutions. My role involved collaborating with cross-functional teams to understand client requirements, architect systems, and implement robust applications.
Software Programmer & Support Analyst
May 2021 - July 2022
As a Software & Programmer Analyst at Cognizant, I played a critical role in ensuring the reliability, performance, and functionality of enterprise systems. My responsibilities spanned server management, code deployment, troubleshooting, client communication, and data analysis, all while maintaining a strong focus on system optimization and client satisfaction.


Key Responsibilities
Frontend Development:
Built responsive and dynamic user interfaces using React.js, ensuring a seamless user experience.
Implemented state management using Redux or Context API for efficient data flow across components.
Integrated RESTful APIs to connect the frontend with backend services.
Middleware Development:
Developed and maintained RESTful APIs using Spring Boot to facilitate communication between the frontend and backend.
Implemented business logic, authentication, and authorization mechanisms to ensure secure and scalable applications.
Optimized API performance and handled exception handling for robust error management.
Backend Development:
Designed and managed relational databases using MySQL, including schema design, query optimization, and data migration.
Wrote complex SQL queries and stored procedures to support application functionality.
Ensured data integrity and security through proper database normalization and indexing.
Collaboration & Tools:
Worked in Agile environments, participating in daily stand-ups, sprint planning, and code reviews.
Used Git for version control and JIRA for project management and task tracking.
Collaborated with UI/UX designers, QA engineers, and product managers to deliver high-quality solutions.
Technologies
Frontend: React.js, HTML, CSS, JavaScript, Redux, Context API
Middleware: Spring Boot, RESTful APIs, Postman
Backend: MySQL, Hibernate, JDBC
Tools: Git, JIRA, Docker, Jenkins
This experience not only strengthened my technical expertise but also honed my problem-solving, teamwork, and project management skills, preparing me to tackle complex challenges in software development.
Key Responsibilities
Server Management & Code Deployment:
Managed server operations and executed code deployments across multiple data centers, ensuring high system reliability and performance.
Deployed and tested application code using DevOps tools and GitHub, verifying compatibility across various platforms and screen resolutions.
Troubleshooting & Issue Resolution:
Troubleshot and resolved network connectivity and user access issues using SQL, achieving a 92% error detection and correction rate within 24 hours.
Conducted daily application performance analyses to ensure optimal functionality across all data centers.
Data Analysis:
Analyzed system performance data to identify trends, bottlenecks, and areas for improvement.
Generated reports and dashboards to provide actionable insights for stakeholders, enabling data-driven decision-making.
Used SQL and data visualization tools to extract, transform, and present data effectively.
Client Communication & Collaboration:
Communicated effectively with internal and external clients via Microsoft Teams, email, and phone, maintaining high client satisfaction.
Documented product defects and enhancement requests in Jira, reducing resolution time by 20% through systematic issue tracking.
Technologies
Database: SQL
DevOps Tools: GitHub, Jenkins, Docker
Collaboration Tools: Microsoft Teams, Jira
Data Analysis & Visualization: SQL, Excel, Tableau, Power BI
Monitoring & Analysis: Application performance monitoring tools
This role allowed me to develop strong technical, analytical, and communication skills, enabling me to deliver high-quality support, drive operational excellence, and provide data-driven solutions.
My Projects
Welcome to my projects gallery! Here, you’ll find a curated collection of my work, showcasing my expertise in data visualization, React.js development, and problem-solving through code. Each project reflects my passion for creating innovative, user-friendly solutions and transforming complex ideas into functional, visually appealing applications. From interactive dashboards to dynamic web applications, these projects represent my journey as a developer and my commitment to continuous learning. Explore below to see how I’ve applied my skills to real-world challenges—and feel free to reach out if you’d like to collaborate or learn more!


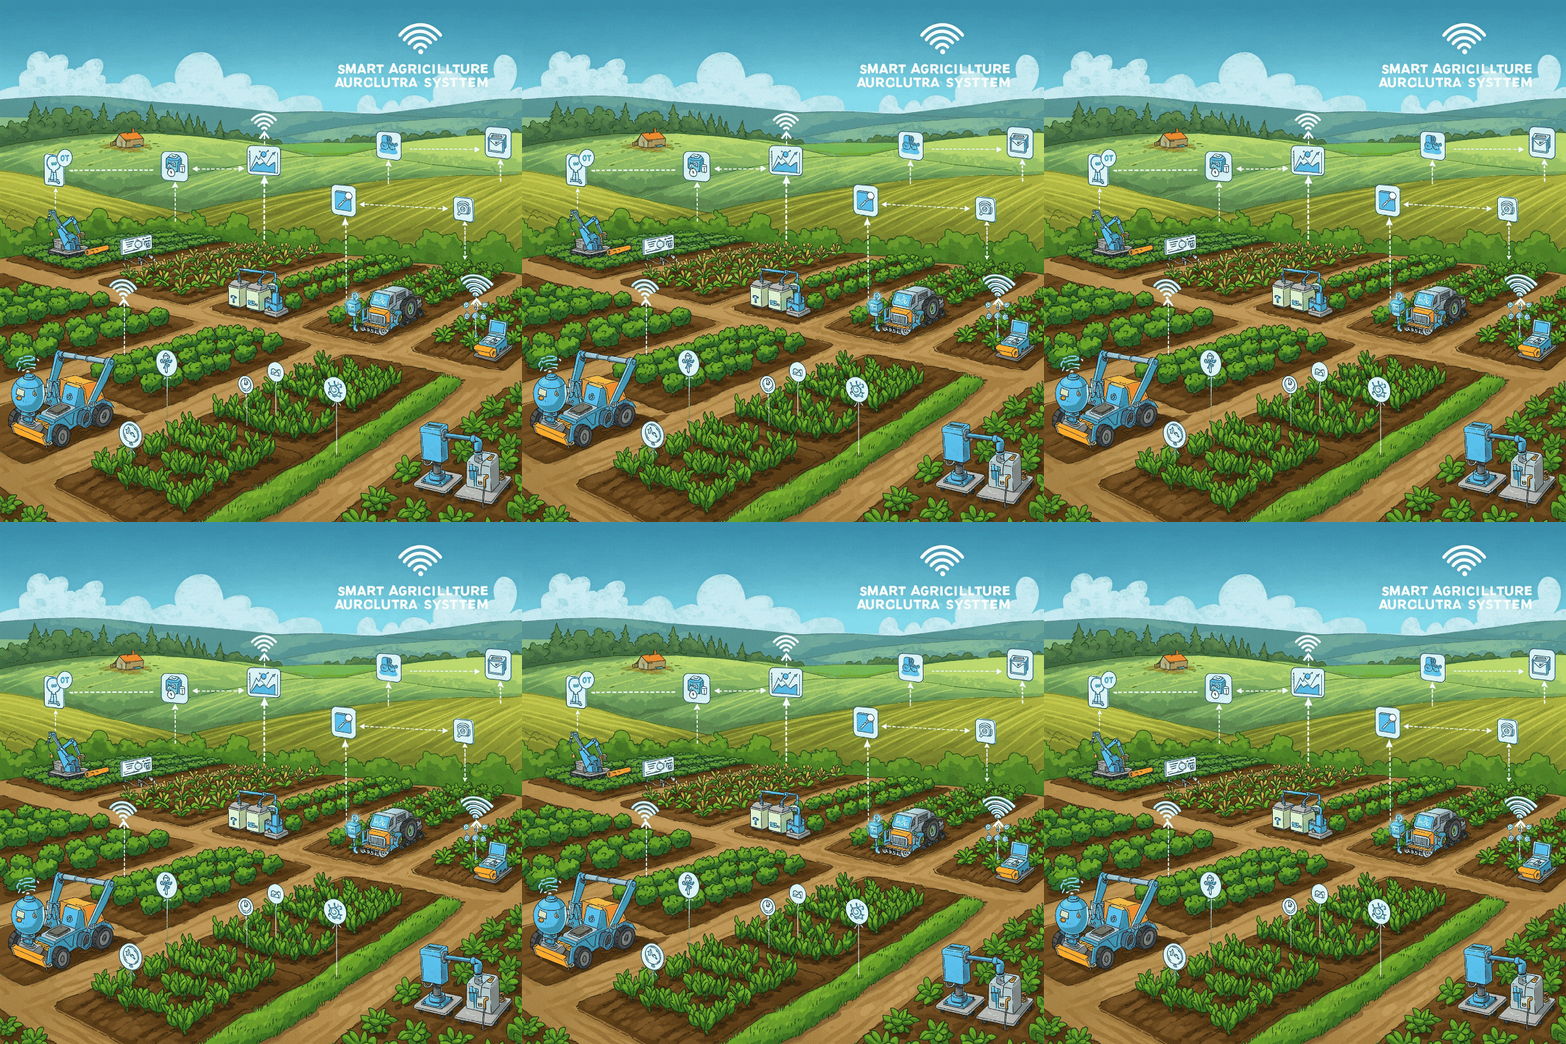
Smart Agriculture System - IOT based Automation
In this project, I have designed and implemented an IoT solution to optimize water usage for farmers. Utilized soil moisture sensors and automated motor control to ensure precise irrigation, reducing water waste by 75%. Developed real-time monitoring features using Arduino, Raspberry Pi, and Python, enabling farmers to track soil moisture levels and enhance agricultural sustainability.


Loan Processing system - Full Stack
In this project, Developed a full-stack web application using React.js, Spring Boot, and MySQL to automate loan approvals. The system features role-based access, real-time status tracking, and automated email notifications, reducing processing time by 30%. Designed to streamline workflows for applicants and admins, ensuring a seamless and secure user experience.
